Large-scale forcing dominates interannual variability of Agulhas leakage
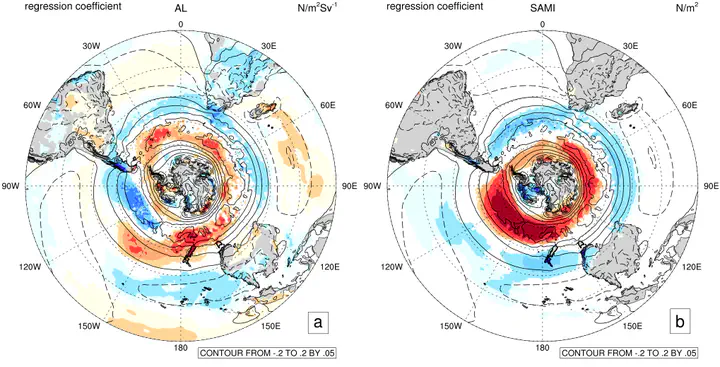 Image Credit: me 😄
Motivation
In our early work, we have shown that Agulhas leakage is highly variable at daily to seasonal time scales, presumably dominated by the passage of Agulhas Rings. Decadal trends of Agulhas leakage are oftend attributed to the changes of Southern Hemisphere westerlies by previous studies. We hypothesize that, at interannual time scales, leakage variability is constrained by large-scale wind forcing, minifesting itself as changing large-scale velocity fields.
Method
Our work is based on a high-resolution configured Community Climate System Model (CCSM3.5) output. The spatial resolution of this simulation for the atmospheric and ocean component is 0.5 degree and 0.1 degree respectively. All the velocity fields used in this project is from an ongoing twentieth century climate change simulation with observed CO2 forcing. Agulhas leakage is quantified using a Lagrangian particle tracking approach, more details can be found in Cheng et al. [2016].
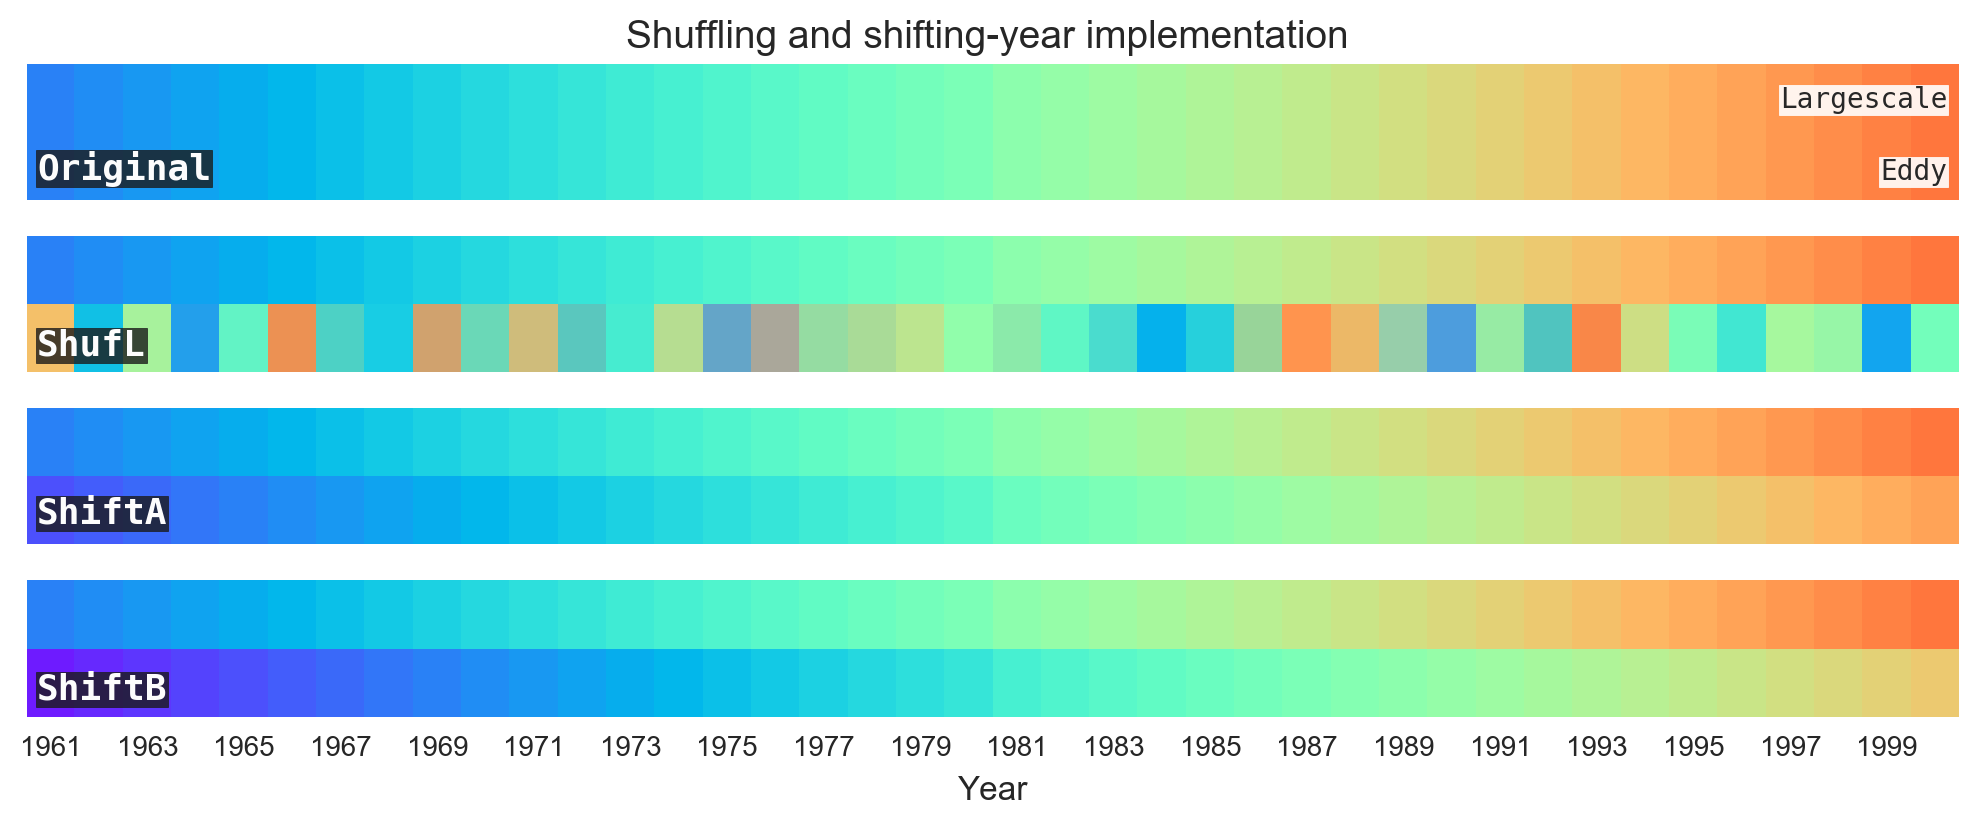
Beside the control case with actual vecolity fields, we designed three testing cases with slighly modified velocity fields. The velocity fields were first decomposed into large-scale fileds using a 500x repeating 9-point spatial smoother (Fig.1). The difference between the original and the large-scale fields are then taken as the eddy-fields. We shuffled or shifted the eddy fields’ temporal order, before plugged them back to the sequential large-scale fields. Forty years of data from 1961 to 2000 are used. By comparing leakage time series using different integration fields, we can show that, at interannual time scales, leakage time series among cases are highly coherent, which is attributed to the commonly-varying large-scale fields.
Time series comparison
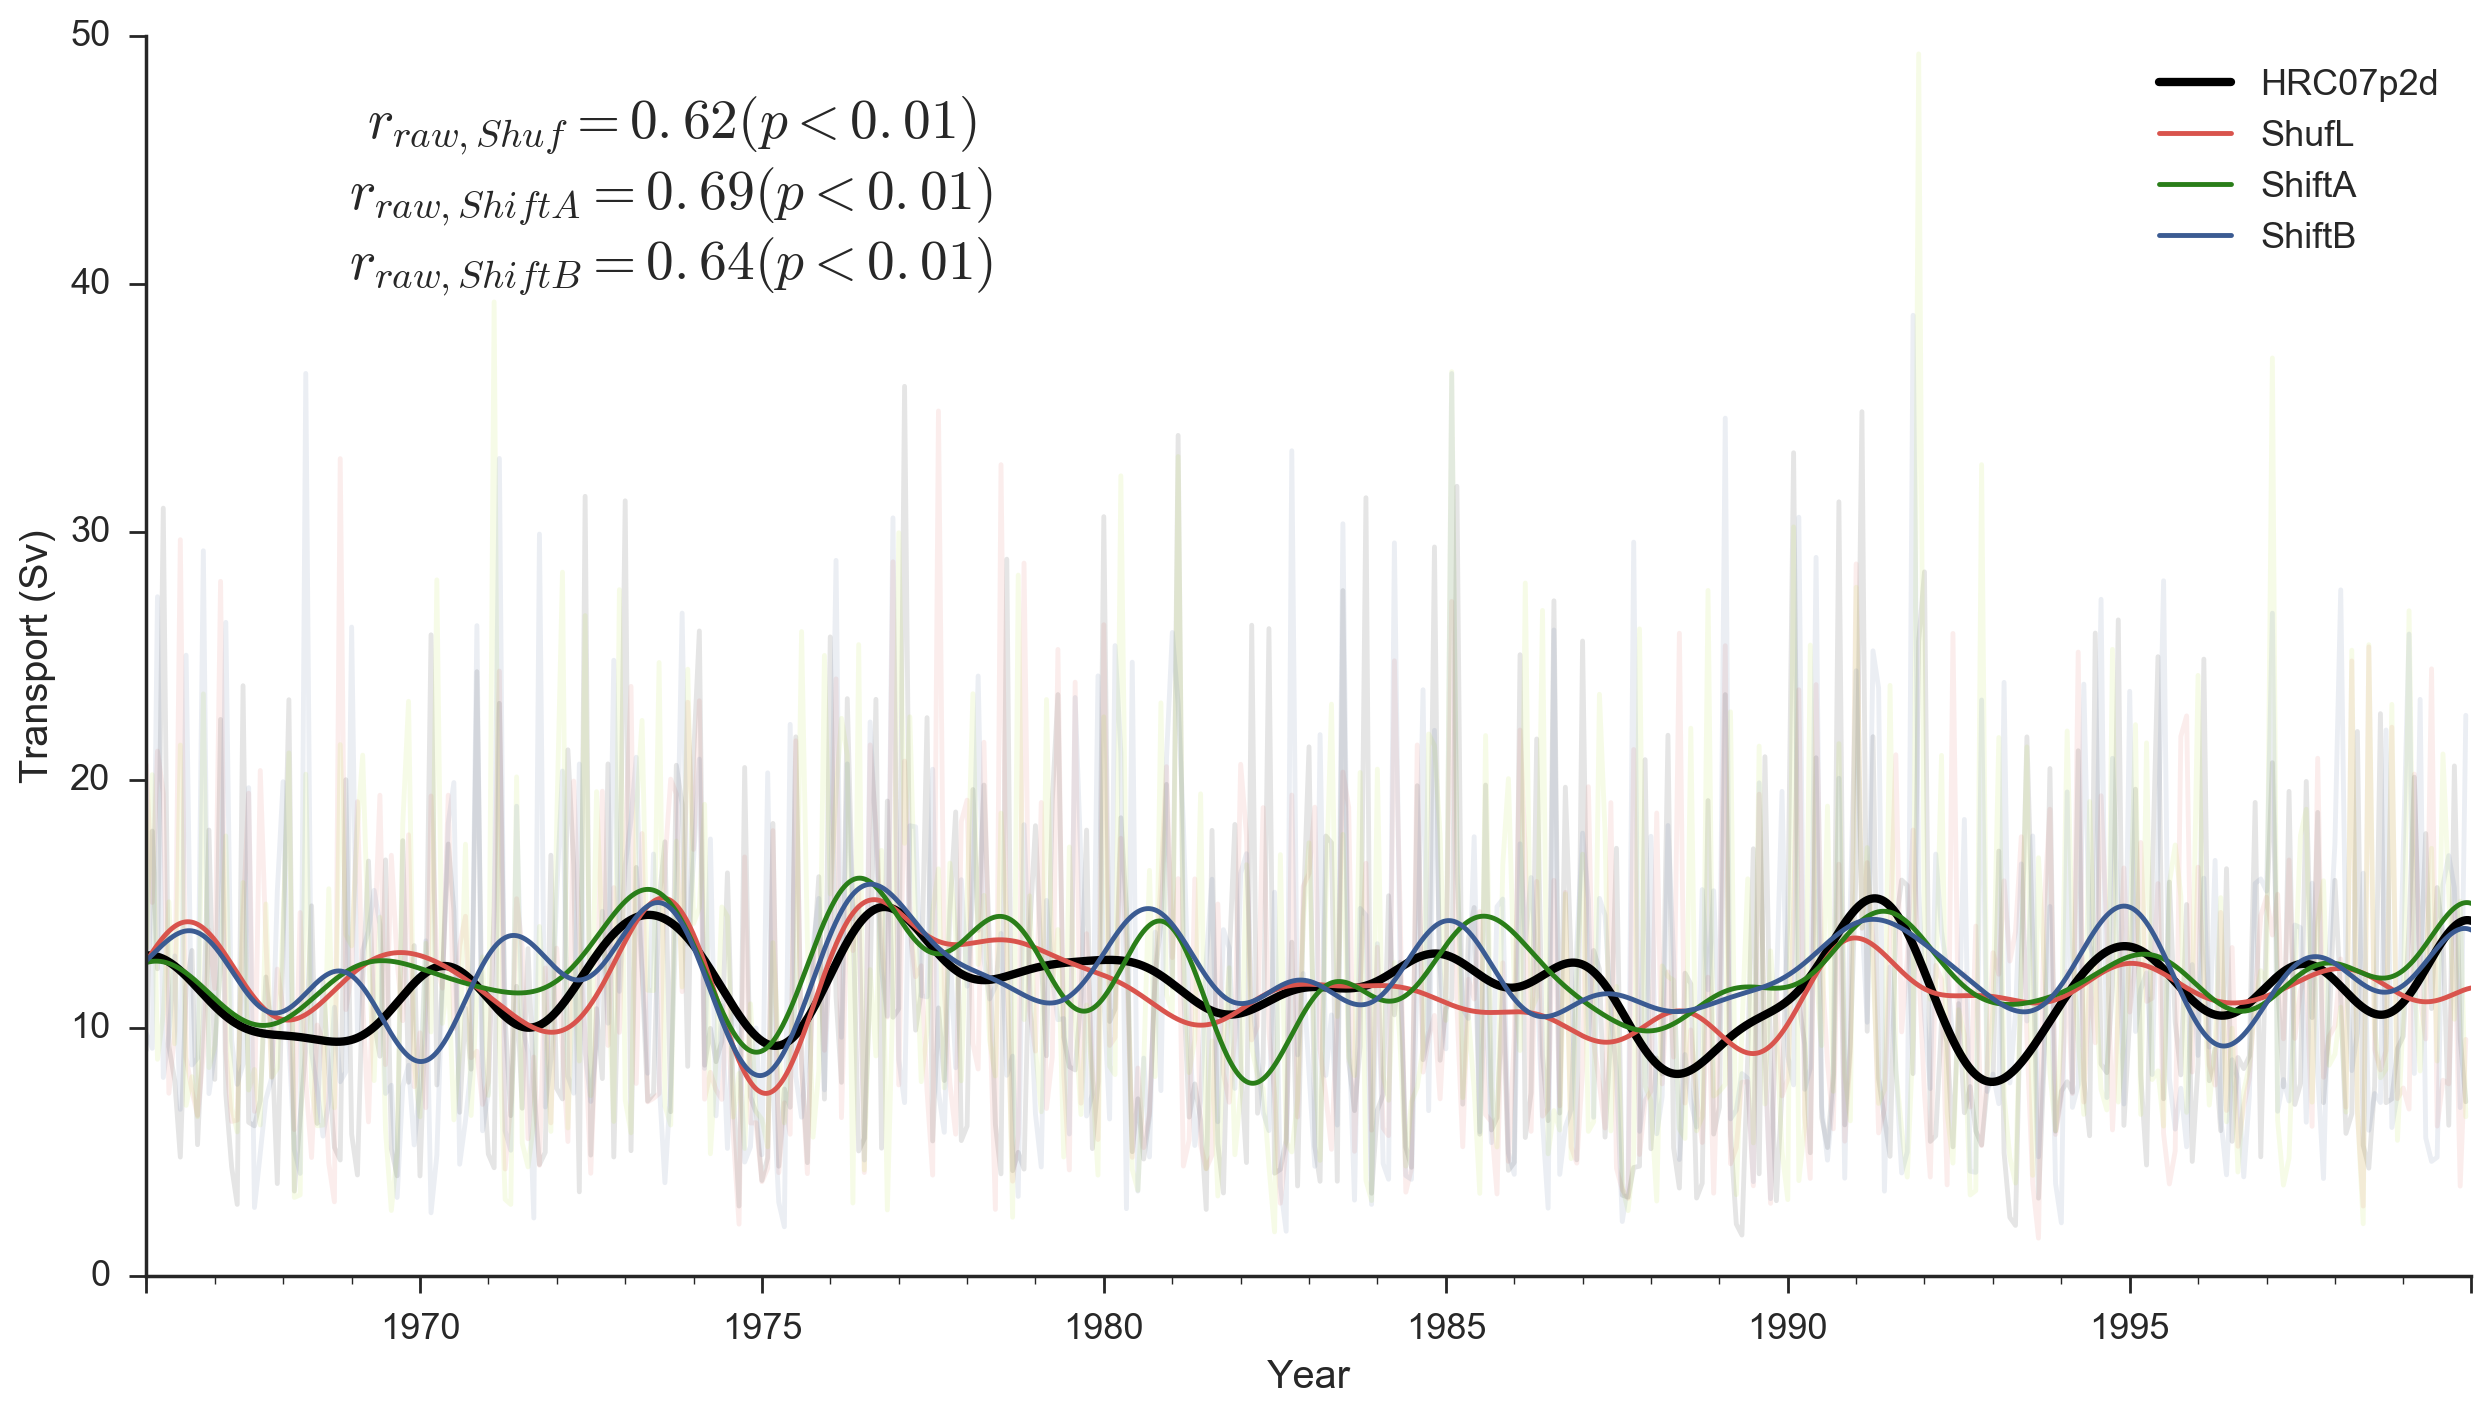
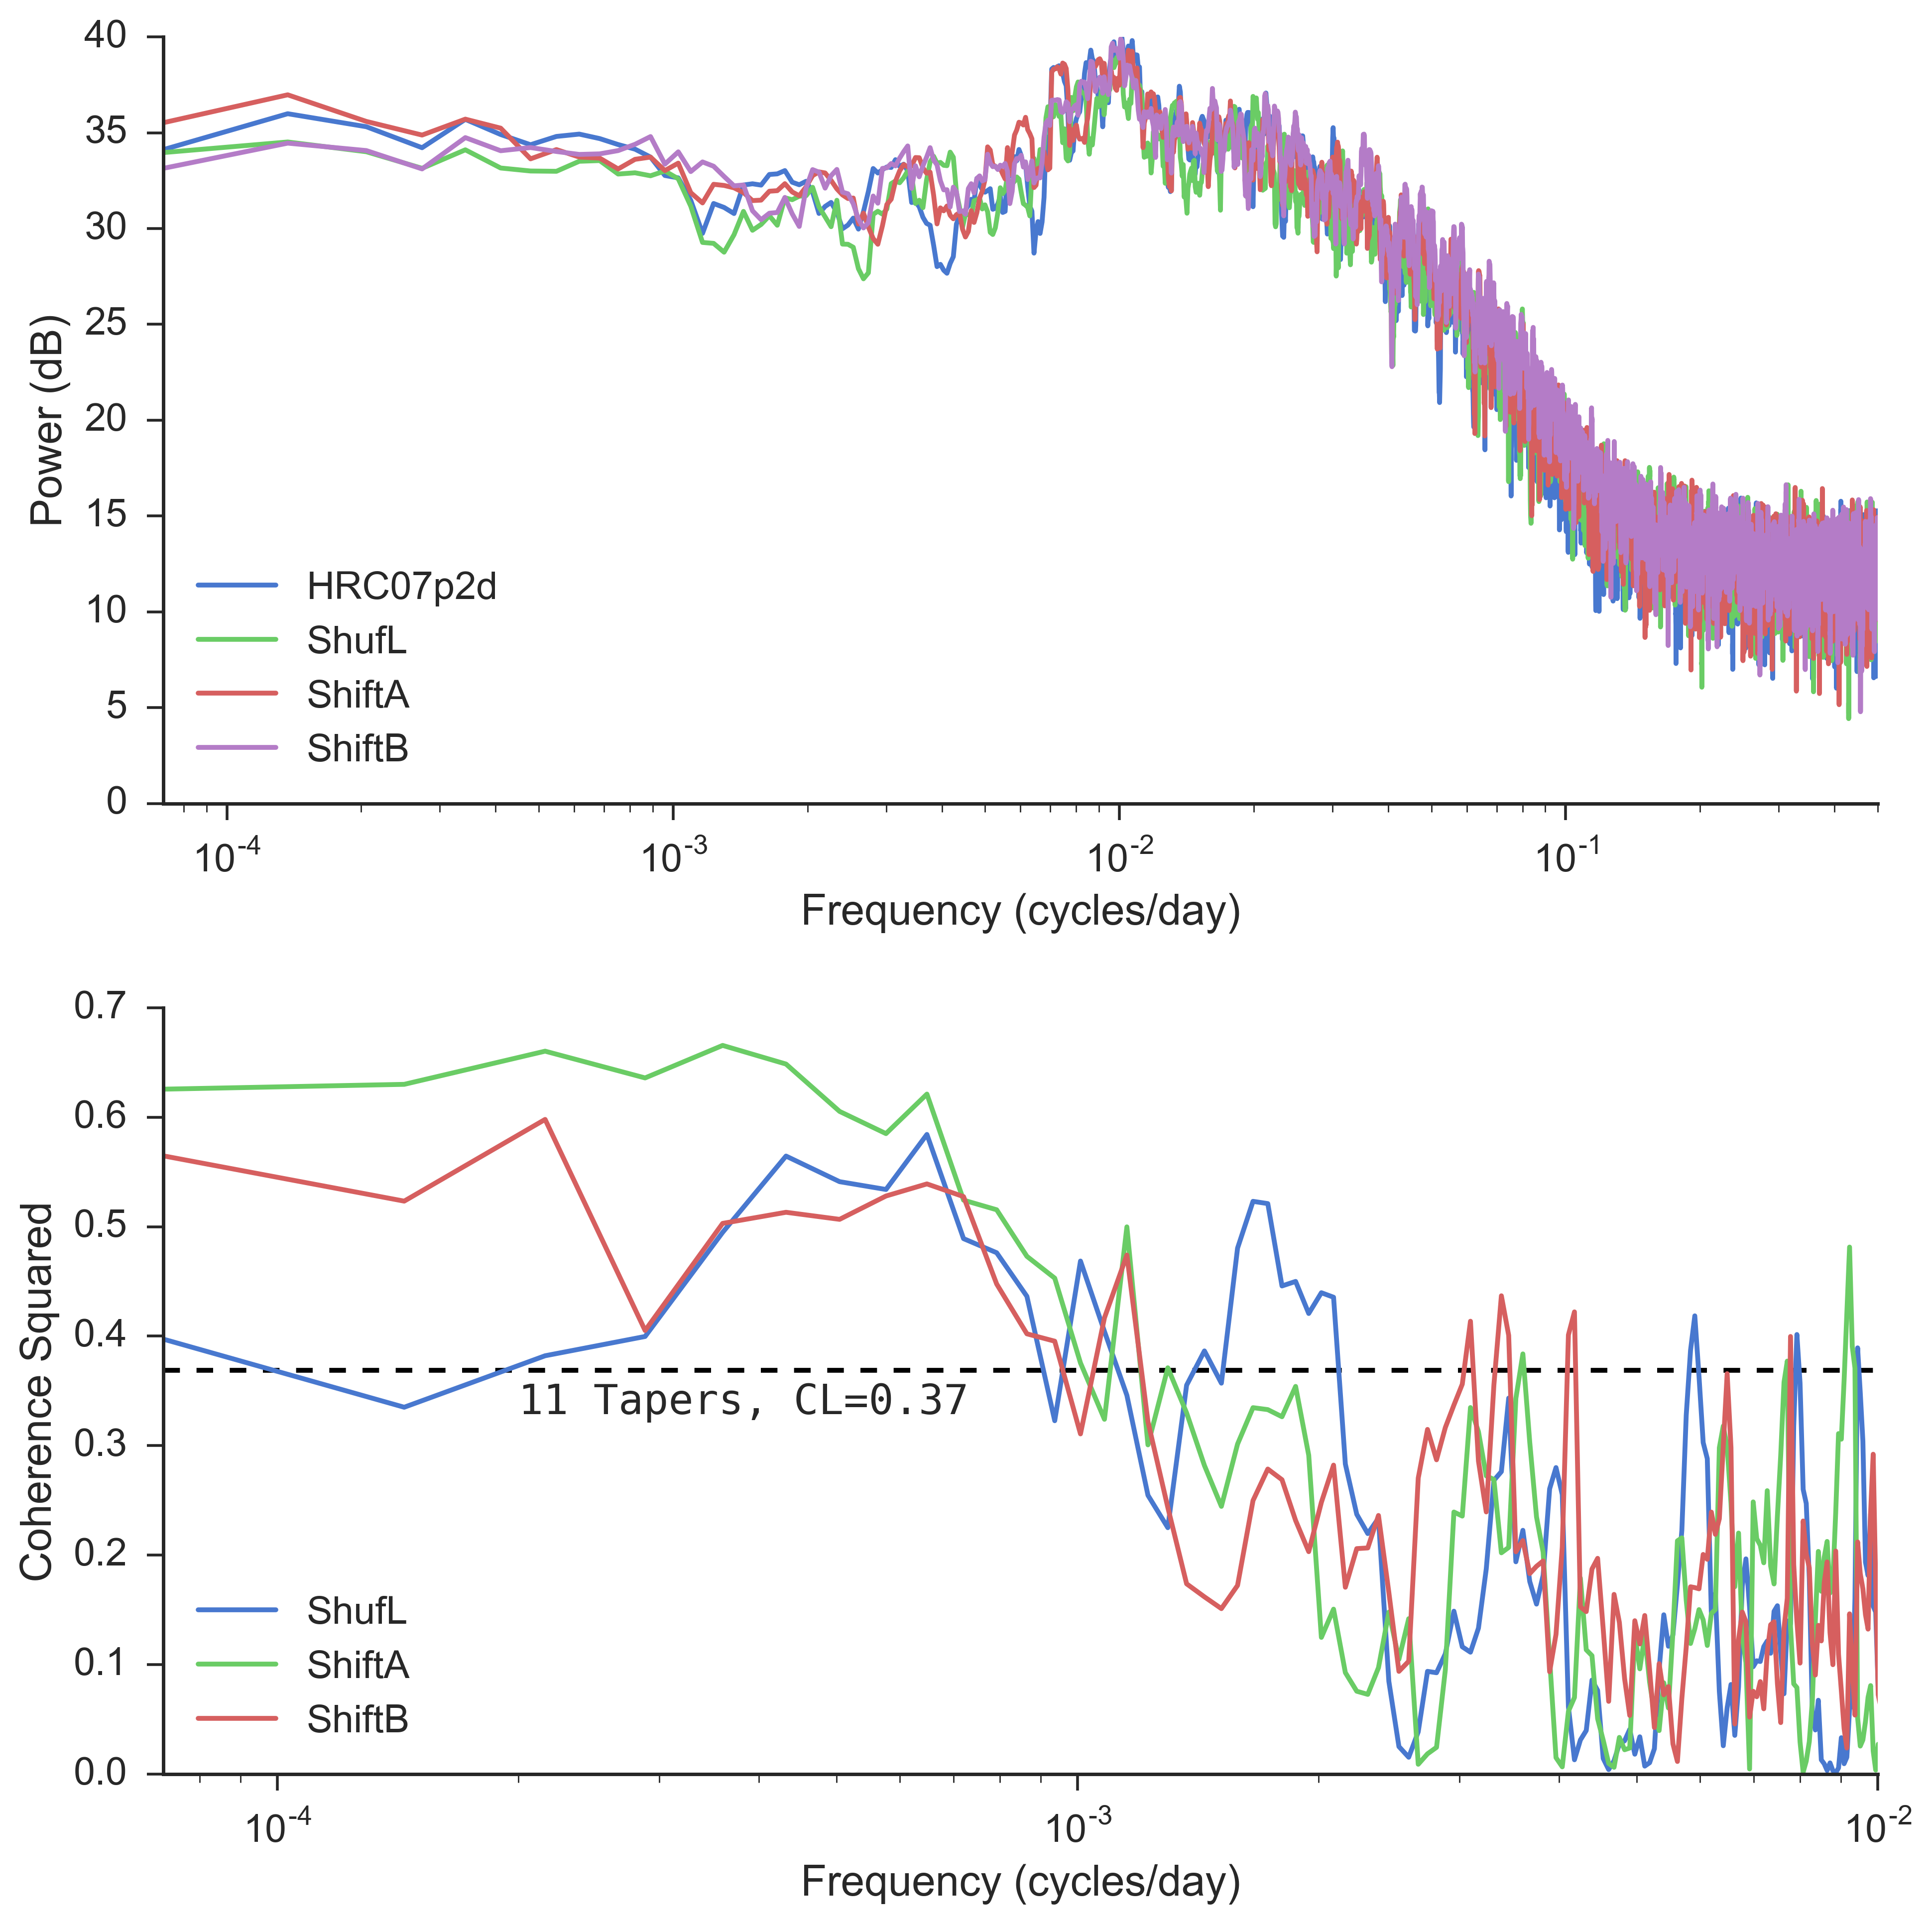
Applying a 24-months low-possed fileds allow us to compare the interannual leakage variability between the testing cases and the reference case. As shown in Fig. 2, the timeseries correlate well above 0.6 (p<0.01). A Coherence analysis further support the hypothesis: leakage time series between cases are highly coherent over time scales longer than 1000 days (Fig. 3).
Regional climate imprints
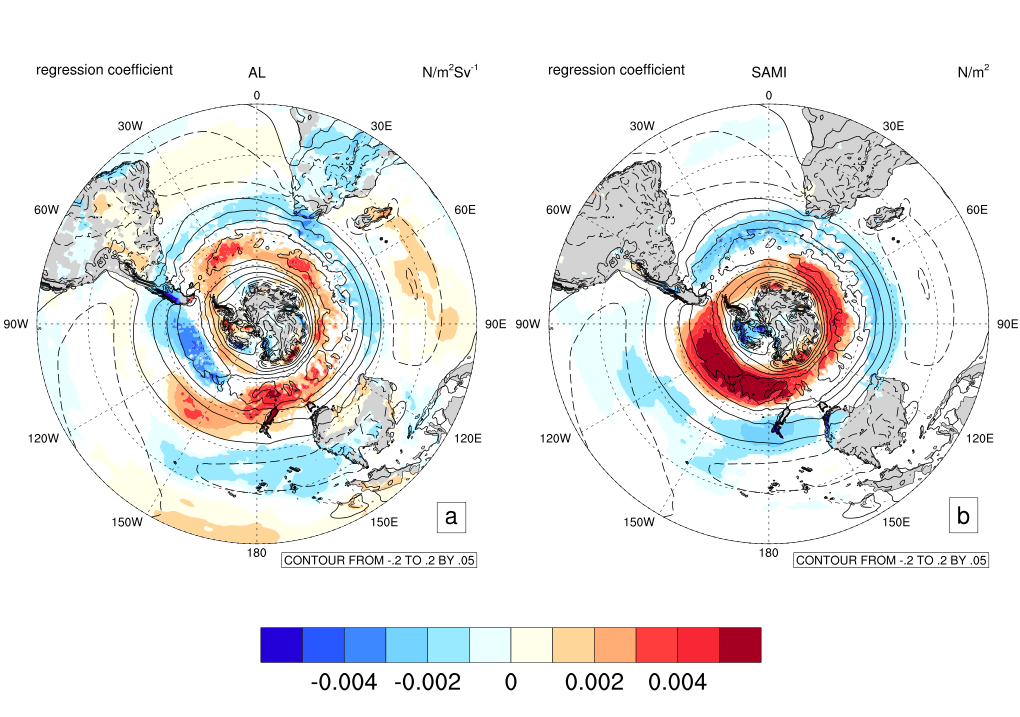
Leakage variability at this time scale is highly associated with the poleward shift of Southern Hemisphere westerlies, as shown in the regression of such to the low-passed Agulhas leakage time series (Fig. 4).
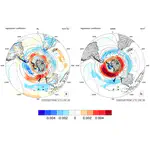
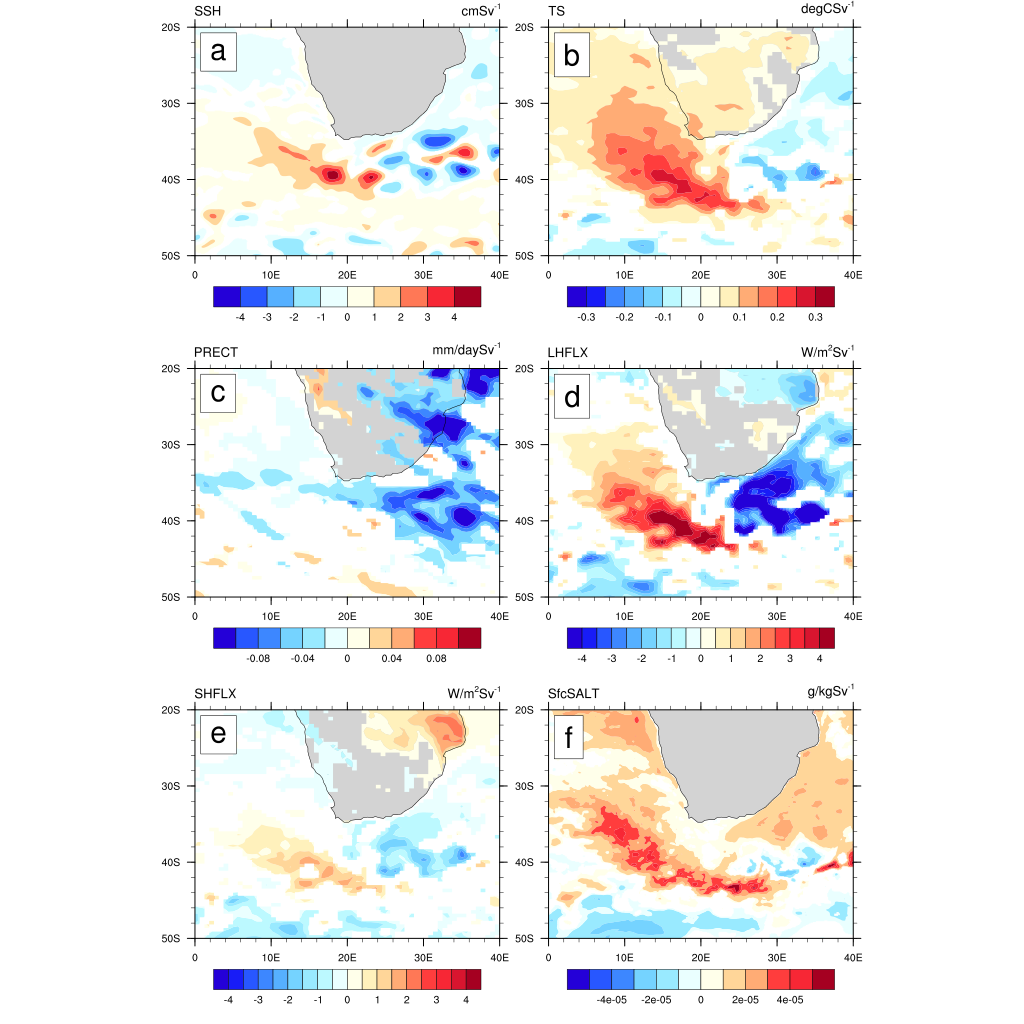
By regressing various climate variables from both atmosphere and ocean, we are able to show some regional climate patterns associated with interannual leakage variability (Fig. 5)
Future work
As the high-resolution climate change simulation still ongoing, we are eager to find out the long-term trends of Agulhas leakage and its effects on the regional climate, South Atlantic Ocean, and Atlantic Meridional Overturning Circulation. We would like to investigate the heat content and northward heat transport variability in the Southern Ocean in our coupled simulation, and relate such to Agulhas leakage.
Yu Cheng 鄭嵎
Sustainability Data Scientist
Passionate about leveraging my past experience to make positive impacts on the planet. Well, raising two wonderful children heartfully is a good start.