Wildfires and climate change
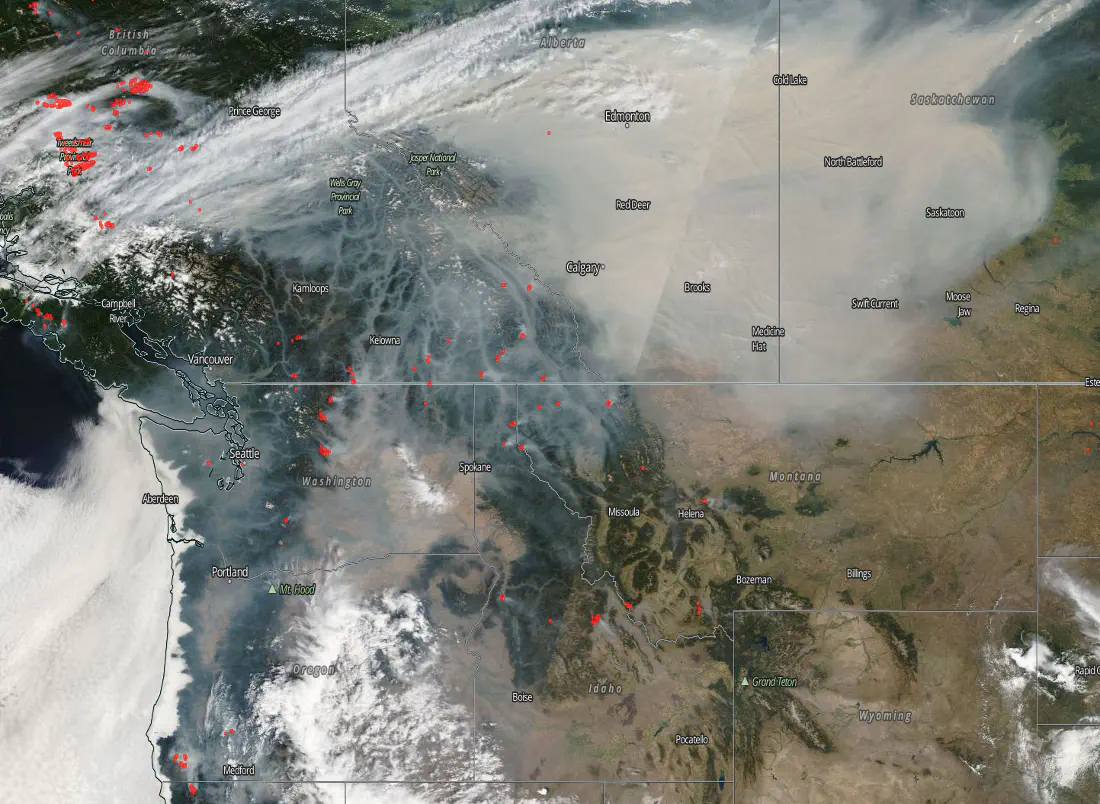 Image credit: WASmoke
I moved to Seattle last summer. And I’ve already experienced three times of smoke this bad. Ironically, I had this impression that Seattle is famous for its good air quality. As many articles pointing out, the wildfires in the surrounding areas are to be blamed. They also suggest that the fires seem to spread wider and last longer than ever before due to the abnormally hot and dry condition this summer. Is it somewhat related to global warming?
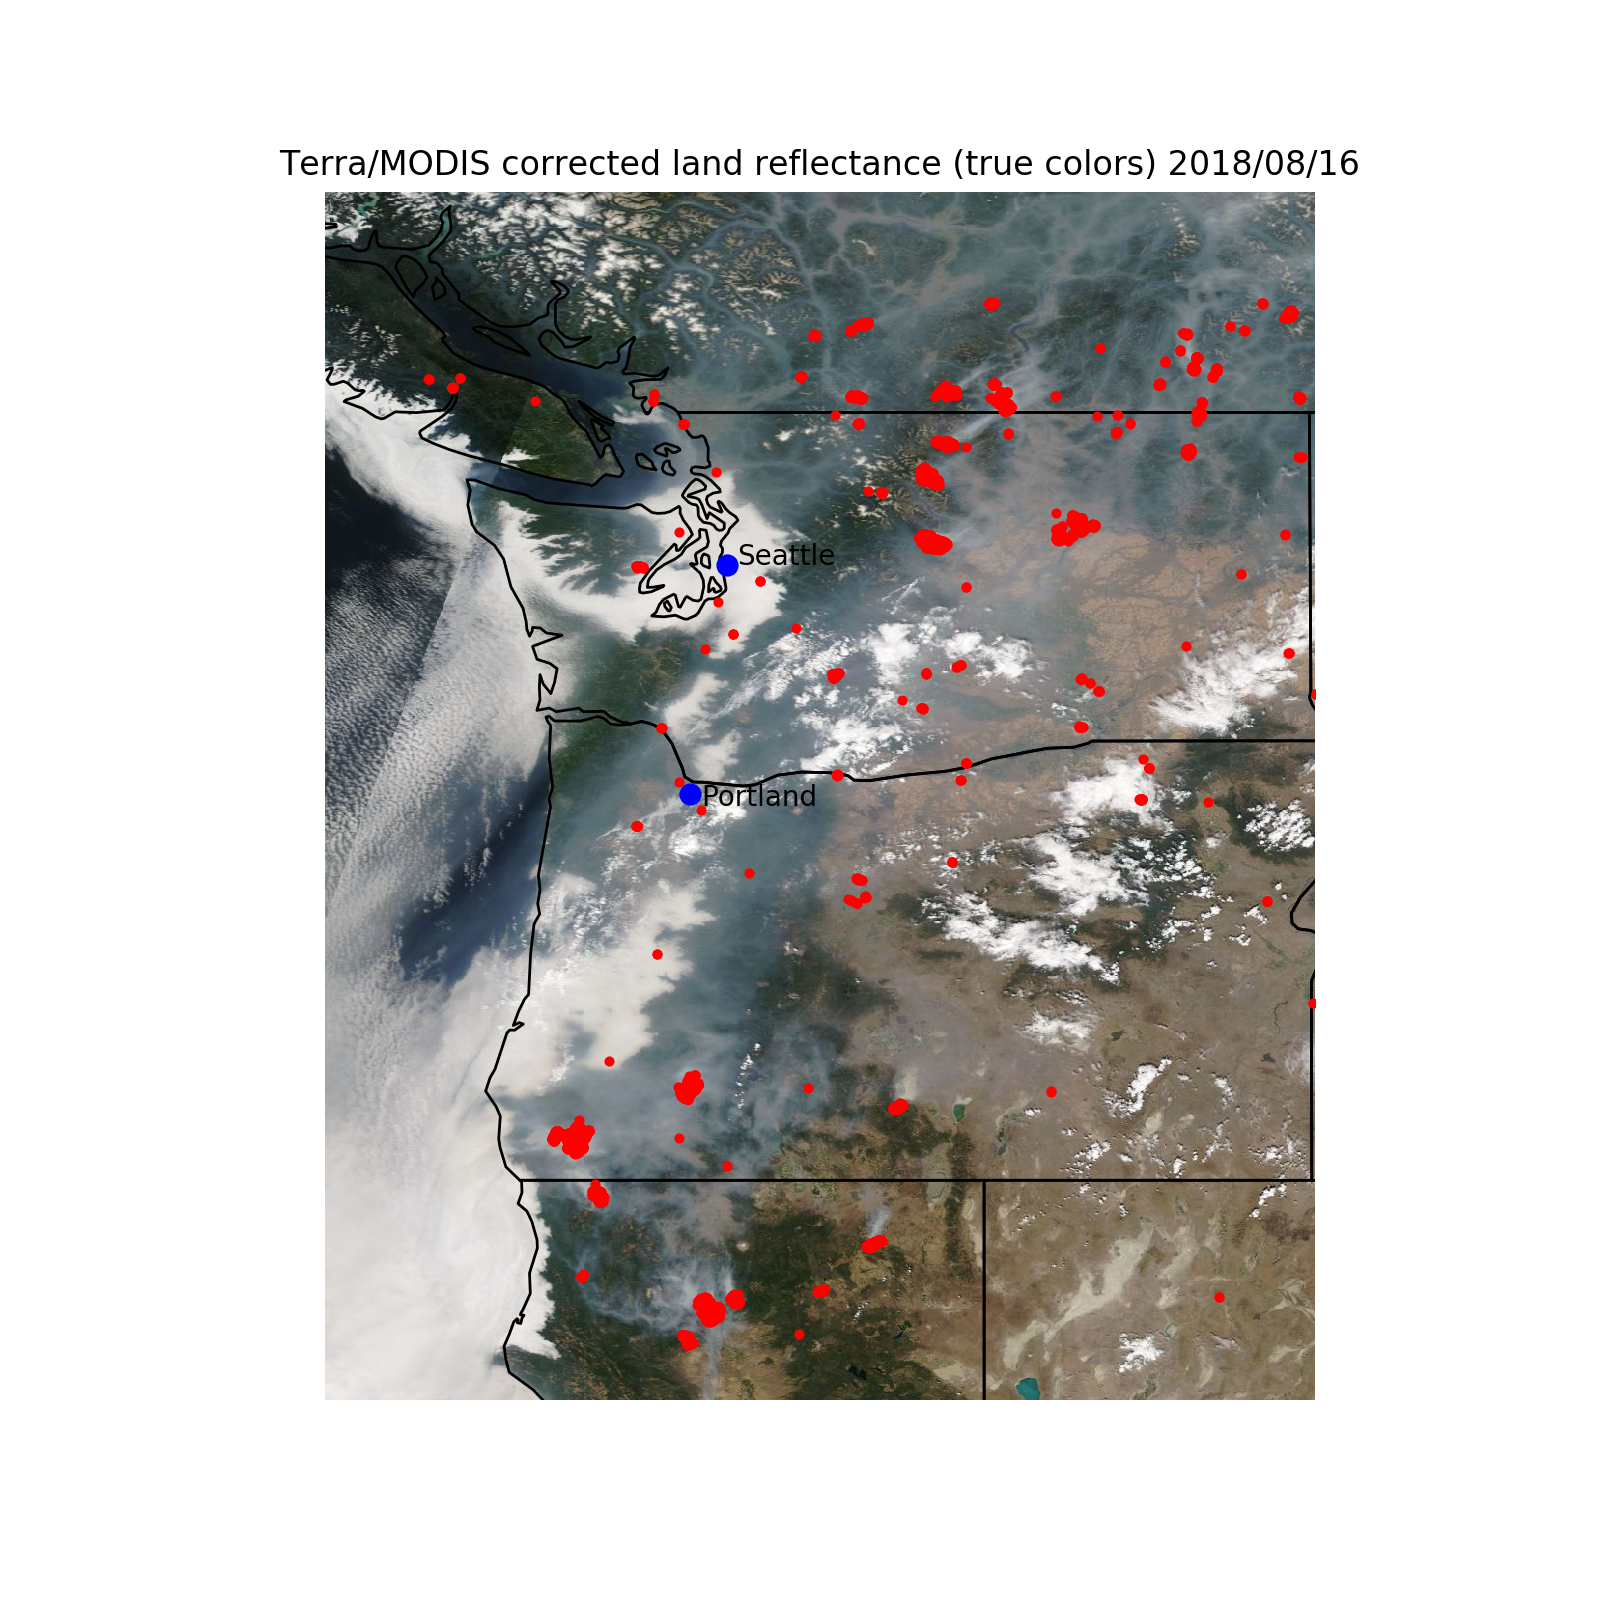
To begin with, I found the active wildfire dataset from the US Forest Service. Two resolutions are available MODIS 1km and VIIRS 375m. You can choose between different regions and time periods. And the MODIS reflectance image is downloaded from the EARTHDATA WORLDVIEW interface.
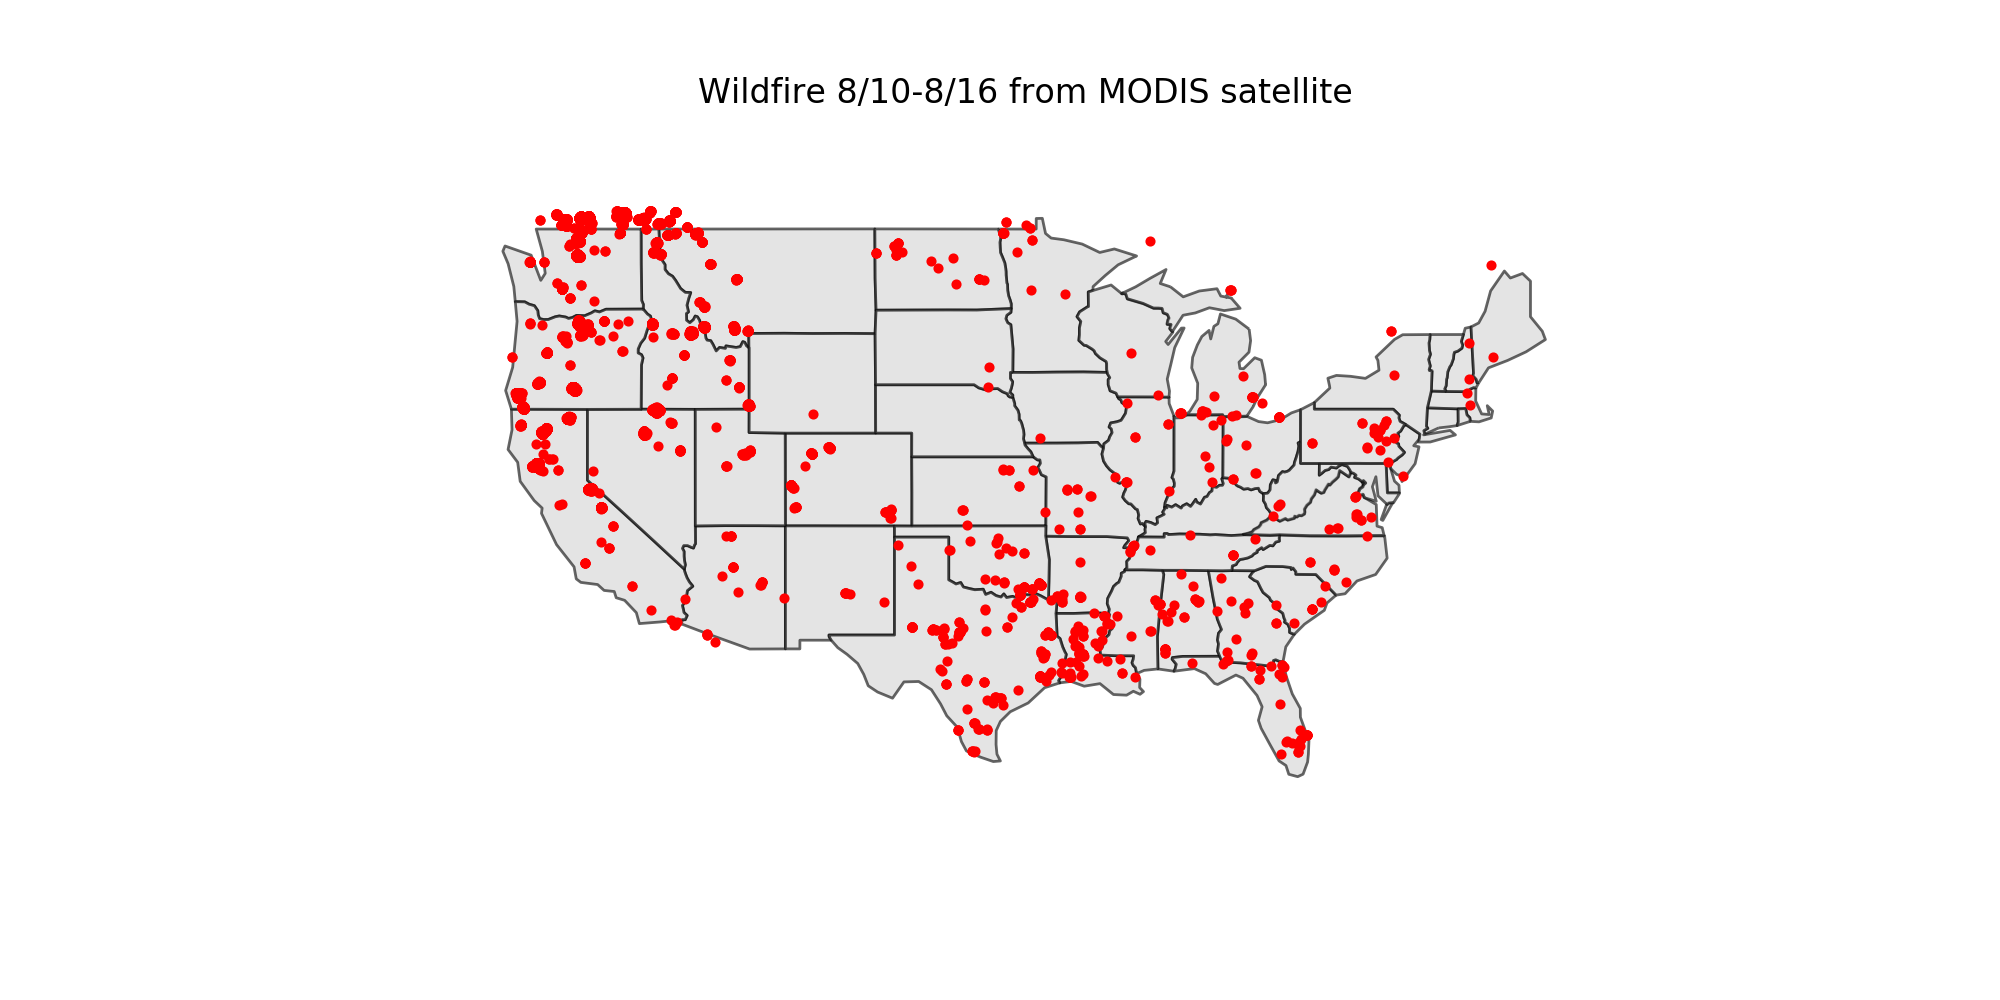
I used geopandas to read the shapefiles, and cartopy to plot the wildfires on the continental U.S.
import cartopy.io.shapereader as shpreader
from cartopy.feature import ShapelyFeature
import cartopy.crs as ccrs

# Change the reference system of Geopandas dataframe to the one Cartopy knows.
crs_epsg = ccrs.epsg('3857')
fp = "modis_fire_last7_2018_234_conus_shapefile/modis_fire_last7_2018_234_conus.shp"
data = gpd.read_file(fp)
df_epsg = data.to_crs(epsg='3857')

#ax = plt.axes([0, 0, 1, 1],projection=ccrs.LambertConformal())
fig, ax1 = plt.subplots(1, 1, subplot_kw={'projection': crs_epsg},figsize=(10, 5))
ax1.set_extent([-125, -66.5, 20, 50], ccrs.Geodetic())

shapename = 'admin_1_states_provinces_lakes_shp'
states_shp = shpreader.natural_earth(resolution='110m',category='cultural',
    name=shapename)
ax1.background_patch.set_visible(False)
ax1.outline_patch.set_visible(False) # Remove the outline, very useful
#ax.coastlines()

for state in shpreader.Reader(states_shp).geometries():
    # pick a default color for the land with a black outline,
    # this will change if the storm intersects with our track
    facecolor = 'LightGray'#[0.9375, 0.9375, 0.859375]
    edgecolor = 'black'

    #if state.intersects(track):
     #   facecolor = 'red'
    #elif state.intersects(track_buffer):
     #   facecolor = '#FF7E00'
    ax1.add_geometries([state], ccrs.PlateCarree(),
                      facecolor=facecolor, edgecolor=edgecolor,alpha=0.6)
df_epsg.plot(ax=ax1, color='red',markersize=7,zorder=51)
plt.title('Wildfire 8/15-8/22 from MODIS satellite')
#plt.savefig('MODIS_map_last_7days.png',dpi=200)
plt.show()
I downloaded the wildfire occurrence data from the USGS website. Here I focus only on the data collected by US forest service. The metadata can be found here. Again, I used geopandas to read the shapefile, and converted interested columns to pandas dataframe. I then changed some columns to the correct dtypes and selected only the major wildfires occurred in the western U.S. The major wildfire is defined as those fires burned over 1000 square acres when controlled.
import pandas as pd

ff = "wf_usfs_1980_2016/wf_usfs_1980_2016.shp"
df = gpd.read_file(ff)

dff=pd.DataFrame(df[['CAUSE','SPECCAUSE','SIZECLASSN','YEAR_','STARTDATED',
    'CONTRDATED','OUTDATED','STATE','TOTALACRES','DLONGITUDE']])

# Clean data
dff['STARTDATED']=pd.to_datetime(dff['STARTDATED'])
dff['CONTRDATED']=pd.to_datetime(dff['CONTRDATED'])
dff['OUTDATED']=pd.to_datetime(dff['OUTDATED'])
dff['LENGTH']=(dff['CONTRDATED']-dff['STARTDATED'])

dff['YEAR']=pd.to_numeric(dff['YEAR_'])
dff=dff.drop('YEAR_',axis=1)

WEST_US_major_fire=dff[(dff['SIZECLASSN']>5) & (dff['DLONGITUDE']<-103)]
Three questions I’d like to answer:
- Has the occurrence of major wildfires increased in the last 30 years?
- Has the wildfire season got longer in the same period?
- Do we have more severe wildfires in recent years?
event_count=WEST_US_major_fire.groupby('YEAR')['STARTDATED'].count()
total_acre=WEST_US_major_fire.groupby('YEAR').sum()['TOTALACRES']
#year=pd.date_range(start='1980', end='2017', freq='A')
season=pd.Series(season_window,index=total_acre.index)
season[season>365]=365
annual_df=pd.DataFrame({'event_count': event_count, 'total_acre': total_acre,
    'season_length':season})
I plotted the wildfire occurence, burned area and season length against the temperature and precipitation reanalysis data I downloaded from NOAA PSD using Altair.
There are clear increasing trends in the average and maximum surface air temperature, as well as a decreasing trend in precipitation over the western U.S. since 1980. The occurrence, burned area, and season length of wildfires all appear to increase during the same period. The burned area and occurrence seem to have strong interannual variability. The average wildfire season length after 2000 is about 70 days longer than that in 1980-2000.
This is a very crude exploration of data. I am fully aware of the danger of mistaking correlation as causation. There are more things to be done, more variables to be considered. For example, after reading through several journal articles, I learned that soil moisture also plays an important role. Unfortunately, the soil moisture is scarcely measured and poorly modeled. I would also like to expand my research by including more wildfire data from other sources.
Yu Cheng 鄭嵎
Sustainability Data Scientist
Passionate about leveraging my past experience to make positive impacts on the planet. Well, raising two wonderful children heartfully is a good start.