Fill in the missing data using Python pandas
 Image credit: Unsplash
One of the many advantages of Python is its abundant and often powerful Libraries. For my research, besides plotting maps, I often play with time series. When it comes to manipulating and plotting time series, no other tools can beat python pandas.
pandas is an open source, BSD-licensed library providing high-performance, easy-to-use data structures and data analysis tools for the Python programming language.
At the core of Pandas are the data structures: Series, DataFrame and Panel. The ones I used the most are the first two. A Series is an array labeled with timestamps, and a DataFrame consists of many Series. In a real-world use case, I use pandas to generate a range of time-axis, which is then attached to my Agulhas leakage time-series. After doing that, the value at a specific timestep can be easily retrieved by calling Series['timestamp']. And to plot the whole time series is as simple as Series.plot().
For a DataFrame, to see the key statistics of a DataFrame with many columns, simply use DataFrame.describe(). A table with mean, standard deviation, counts, and percentiles will then pop up. To compare multiple time series visually, naively put DataFrame.plot().
Working with missing data
Recently, I am calculating the Atlantic Ocean Heat Content (OHC).
#headers=['date','OHC2000','OHC300','OHC700']
OHC_multilevels=DataFrame.from_csv('OHC_HRC07_1951-2002.csv')  # If it's pandas generated, this is much easier.
OHC_multilevels.plot()
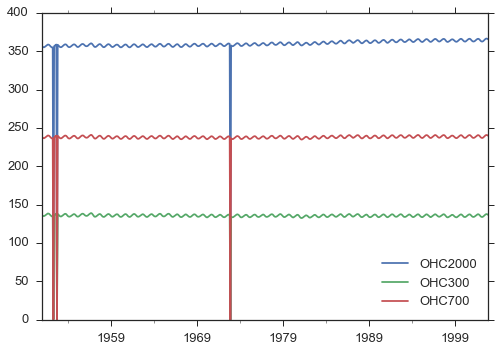
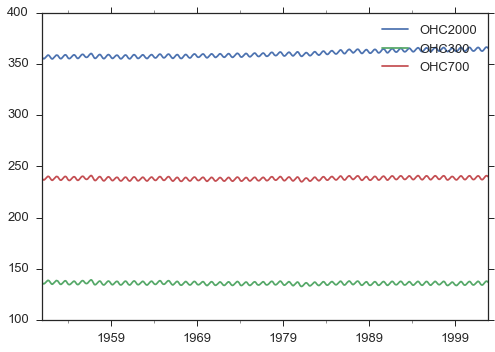
Obviously, something fishy happened near 1952 and again in 1971. Several months have values close to zero, which is unlikely. Going back to the data, I confirmed that the temperature and salinity fields of those months are missing. To clean up the time series, I first assigned None to those months, and interpolate linearly using the neighboring months. Three time series in the same DataFrame are processed using following two lines.
OHC_multilevels[OHC_multilevels<100]=None
OHC_multilevels.interpolate().plot()
This is just a glimpse of the awesomness of pandas. More details can be found in the official documentation.
Yu Cheng 鄭嵎
Sustainability Data Scientist
Passionate about leveraging my past experience to make positive impacts on the planet. Well, raising two wonderful children heartfully is a good start.